Part2:
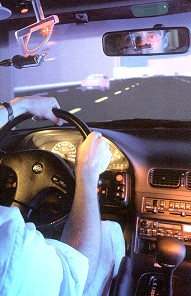
Whats going on at the drivers eyes?
Context dependence of eye movements
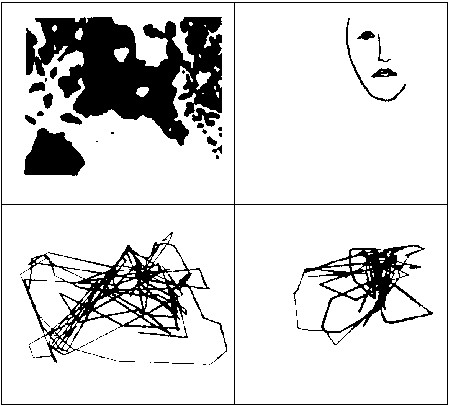
Eye movements before (left) and after (right) recognition. Adapted from Stark & Ellis (1981)
So now, let me explore a little bit about what we are assuming is going on at one end of the system the drivers eyes. The working assumption is that where we move our eyes is dependent on what we want to do or find out. In this example from Ellis and Stark in 1978, the recorded eye movements before the ambiguous figure is recognized, are wide ranging covering all parts of the image. But once the face is recognized, the eye movements become much more restricted in scope. This was also shown by Yarbus (1967) in his book when people were asked about different features of pictures people obviously scanned them according to what they needed to find. It shows that the world is not seen in high detail all at once thats only an illusion stemming from our mental model of the world.
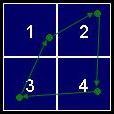
Fixations when viewing a Necker cube
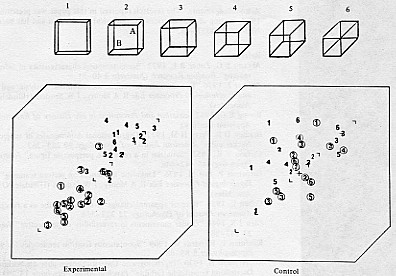
From Ellis & Stark, 1978
Ellis and Stark (1978) had also looked at viewing an ambiguous figure, in this case, the Necker cube, and found that when perceptual reversals of the cubes orientation were self-initiated, the initial fixation moved to the externally appearing corner (left). Also had a longer duration than others perhaps reflecting time to construct the new interpretation of the cube. The right shows fixations during free viewing from a matched subject sampled at the same time as the previous reversals.
Eye movements in lane keeping
- For straight roads with little traffic
- Many fixations are at the focus of expansion
- Possibly experienced drivers fixate further away from the car (e.g., Mourant & Rockwell, 1972)
- When traffic is present
- Leading vehicles attract most fixations
Eye movements in curve negotiation
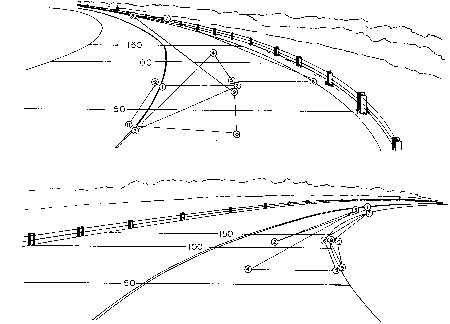
From Gordon (1966)
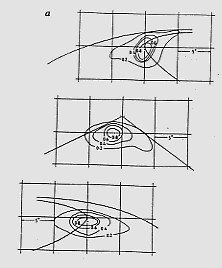
From Land & Lee, 1994
Drivers exhibit characteristic eye movements in different driving situtations. Curve driving is characterized by looks to certain areas of the road, for example, tangent point. Again, another feature of using eye movements is that they generally precede actions, so that prediction may be possible.
Eye movements precede physical movements
From Land & Lee, 1994
Eye movements with in-car displays
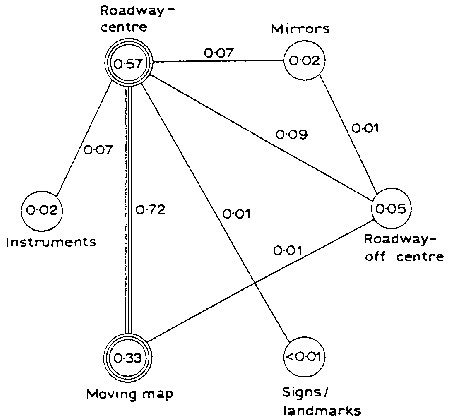
With moving map displays (From Antin et al., 1990)
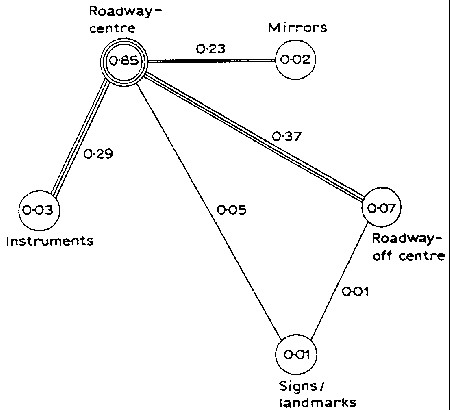
Without moving map displays (From Antin et al., 1990)
Use of instruments in a vehicle also alter fixation patterns, as expected. Using Wierwilles link probability measure, see changes in the pattern of the most frequent transitions between different regions. Thus use of the navigation system could be signaled by this shift in transition probability.
Lane changing behavior
- Activity takes place before lane position changes substantially.
- Steering changes prior to action are more subtle.
- EM shift before the lane change is initiated.
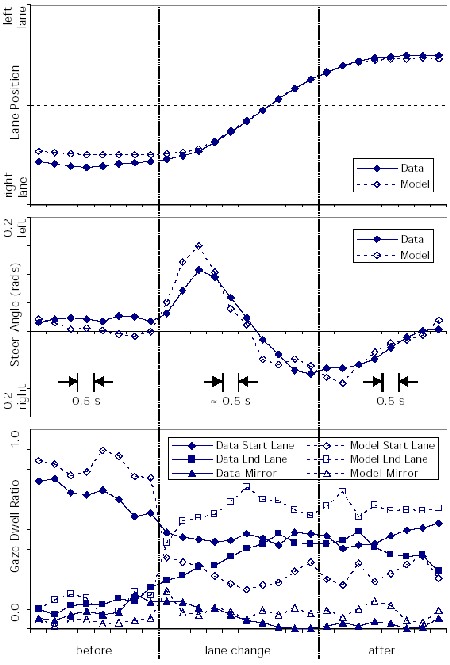
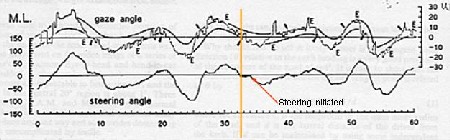
Lane position, steer angle, and gaze dwell ratios before, during, and after lane changes. From Salvucci et al. (2001).
Temporally, we also see revealing behavior in the eye movements. In the bottom plot we are looking at the gaze time at certain parts of the road and the rear-view mirror. Note that in the period preceding the lane change, there is a shift in the gaze duration to the mirror (small bump) and the lane the driver will be moving into. Note that the steering and lane position have not changed at this point.
This gives the models great predictive power to possibly perform an action in advance of the actual maneuver.
Eye movement analysis approaches
- Zero-order statistics
- Fixation durations, distribution over regions of interest (ROI), variance
- Link probability measures
- Fixation pairs or triads
- Markov models
- Cognitive models (e.g., ACT-R)
- Typical analysis looked at zero-order statistics - e.g., fixation or dwell times. These provide interesting information about what features in the scene may be salient to the driver, but it also ignores any information carried in the sequences of fixations.
- Link probability measure is a first-order statistical measure of the transitions between two regions, however, it doesnt account for the direction of the transition. These can be derived from the joint probabilities of the Markov transition matrix although the converse is not true.
- Fixation pairs or triads look for very short scanpaths (2 or 3 fixations only). The Groner et al. (1984) paper identified the presence of statistically distinct fixation triplets in a face recognition task. They also found that successful rejection of unknown faces was correlated with presence of scanpaths (local scanpaths) although the presence of scanpaths negatively correlated with correct identification. The Underwood et al. (2003) paper adopted ideas of the Liu et al. (1998) paper but extended to look at naturalistic scenes and the effect of driving experience on scanpaths. Interestingly, looking at single fixations (zero-order), there was no systematic difference in single fixation behavior over all their regions and road types, but pairs and triplets showed systematic differences.
- Markov models are useful in analyzing fixation sequences with mathematical formulation. Higher-order analysis (3rd order or higher) is difficult for eye movements due to large amount of data (long fixation sequences) required for such analysis.
- Cognitive models are useful for describing behavior in context of a rigorous theoretical foundation of perceptual and cognitive mechanisms. They can be quite useful for simulations in generating eye movement behaviors based on a model.They could be used as a basis for the cars brain generating expected driver actions still needs a framework for tracking observed actions and comparing results (HMM or MDMs).
Markovian analysis of eye movement patterns
A transition probability matrix is used to characterize the movement of fixation among regions of the scene (Stark & Ellis, 1981).
|
| | Target region |
| 1 | 2 | 3 | 4 |
Fixation
region | 1 | .2 | .7 | .1 | .0 |
| 2 | .1 | .1 | .2 | .7 |
| 3 | .9 | .0 | .1 | .0 |
| 4 | .2 | .2 | .6 | .0 |
|
The basic approach is that one can construct a transition probability matrix that captures the movement of the fixation among regions of a scene. Suppose that you have a scene divided into regions. You identify the fixations and identify the transition matrix by following the movement of the fixation. This is a first-order matrix in that the next fixation (target) is solely determined by the probabilities from current region. Can look at higher order but typically human eye movement patterns are not long enough to get good data.
Modeled eye movements when looking at ambiguous figures. Transition matrices for before recognition and after are different. Ellis (Ellis & Smith, 1985; Ellis & Stark, 1986) has also developed some statistical methods to test difference between matrices.
Markov analysis of driver eye movements
Transition probability matrix (from Liu et al., 1998)
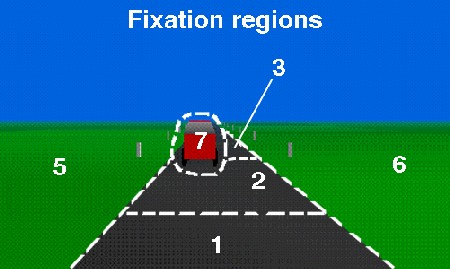
Fixation regions. Region 4 is even further ahead of the car. Region 8 represent fixation to the dashboard or elsewhere (from Liu et al., 1998)
A little history of Markov eye movement analysis from Stark and Ellis (1981). Scanpath theory ...
One nice aspect of using eye movements is that Markov models can be used to characterize the fixation patterns. I have also been doing some research into using Markov models for model driver eye movements. Consider a driving scene like the one on the right. If we divide up the scene into different distinct regions, we can construct a transition probability matrix that describes the movement patterns. We can also use the transition matrix to identify distinct patterns from each other. In this case we have two overlapping patterns; one for driving on the open road and another for the task of following the car ahead.
One potential pitfall is dynamic scenery - regions may come and go
This suggests that monitoring eye movements might also be useful for predicting intentional state.
|
|